{{'Report: ' + projectName}}

1. Introduction
For the project {{projectName}} of {{projectData.CompanyName}} the calm water powering performance has been assessed and ranked to alternative designs of the world fleet. By means of computational fluid dynamics (CFD) various sailing conditions have been simulated by DNV's Ship Performance Simulator (SPS) methodology. This methodology takes advantage of full scale Volume of Fluids (VoF) computations solving the Reynolds Averaged Navier Stokes Equations (RANSE).

The computation setup is selected to specifically aim at highlighting the propulsion performance of the hull itself and therefore the propulsion simulations utilize a standardized and simplified propeller model. Further, benchmarking of the current vessel is done with similar projects in DNV's Ship Performance Simulator database. As SPS's methodology ensures a consistent assessment and best comparability of alternative designs this feature gives a perfect view on the performance level of the current design.

This report summarizes the provided hull and propeller details, describes the methods and procedures used and presents the numerical results.
2. Simulation Program
The following sailing conditions have been investigated:
Table 2.1: Computational cases
TA [m] TF [m]   v [kn]
{{programe.draftA | number:2}} {{programe.draftF | number:2}}   {{speed | number:2}}
3. Vessel overview
3.1 Main Particulars
The vessel under consideration features the following main particulars:
Table 3.1.1: Main particulars - Overview
Vessel type: {{projectData.ShipType}}
Design Reference: {{projectData.DesignReference}}
LOA [m] LPP [m] BOA [m] Tdes [m] Tsca [m] Density [kg/m³]
{{projectData.LOA | number:2}} {{projectData.LPP | number:2}} {{projectData.BOA | number:2}} {{projectData.T_DES | number:2}} {{projectData.T_SCA | number:2}} {{conditionsRho}}
The hull lines are customer input and have been checked for their quality w.r.t. Computational Fluid Dynamics (CFD) applicability.
The hull lines have been derived from structural drawings provided by the customer. More information on the digitalization process can be found in the Procedure chapter.
3.2 Propeller Details
The open water efficiency of a Wageningen B-series propeller is used for the prediction of the self-propulsion predictions. It has been selected based on the given input parameters: propeller diameter, blade number, expanded blade area ratio and pitch ratio.
The propeller’s open water table used for the numerical computations has been provided by {{projectData.CompanyName}}. The self-propulsion prediction is based on this data.
Table 3.2.1: Propeller details overview
Number of
propellers
D [m] Z [-] AE/A0 [-] P/D [-]
{{propeller == "Wageningen B-Series" ? projectData.PropCountW : projectData.PropCountC}} {{(propeller == "Wageningen B-Series" ? projectData.DiameterW : projectData.DiameterC) | number: 2}} {{(propeller == "Wageningen B-Series" ? projectData.BladesCountW : projectData.BladesCountC)}} {{(propeller == "Wageningen B-Series" ? projectData.AreaRationW : projectData.AreaRationC) | number: 3}} {{(propeller == "Wageningen B-Series" ? projectData.PitchRatioW : projectData.PitchRatioC) | number: 3}}
Figure 3.2.1: Open water diagram

Table 3.2.2: Open water table
J [-] {{row.J}}
KT [-] {{row.KT}}
10KQ [-] {{row.KQ}}
ETAO [-] {{row.ETA}}
4. Hydrostatics
TABLE 4.1 presents the hydrostatic particulars in {{projectData.WaterType == "Salt"? "salt water (density 1025 kg/m³)" : "fresh water (density 999 kg/m³)" }} for all calculated drafts at full scale. As usual, the hydrostatics consider the moulded shape as given in the geometry provided. The list of symbols can be found in Section 8.1:
Table 4.1: Hydrostatic results - Overview
TA [m] {{ta}}
TM [m] {{tm}}
TF [m] {{tf}}
LPP [m] {{lpp}}
LOS [m] {{los}}
BWL [m] {{bwl}}
Volume [m³] {{volume}}
DISPL [t] {{displ}}
LCB [m] {{lcb}}
WSA [m²] {{wsa}}
CB [-] {{cb}}
CP [-] {{cp}}
KMT [m] {{kmt}}
5. Trial prediction
Based on the simulation results, a trial prediction has been done which is shown in the following plot(s). Please see section 8.3 for details of the prediction method. The table below provides links to view the 3D flow details of each simulation.

Figure 5.1: Trial prediction for 0 Beaufort wind

Table 5.2: Full scale - trial prediction
TA
[m]
TF
[m]
v
[kn]
Fn
[-]
RT*
[kN]
PE*
[kW]
TH
[kN]
PD
[kW]
w
[-]
t
[-]
ETAO
[-]
ETAR
[-]
ETAH
[-]
ETAD
[-]
{{row.ta | number: 2}} {{row.tf | number: 2}} {{row.vs | number: 2}} {{row.fn}} {{row.rt}} {{row.pe}} {{row.th}} {{row.pd}} {{row.w}} {{row.t}} {{row.etao}} {{row.etar}} {{row.etah}} {{row.etad}}
Table 5.3: Dynamic floating condition
TA [m] TF [m] v [kn] Fn [-] WSA [m²] S [m²] Trim [m] Sink [m]
{{row.ta | number: 2}} {{row.tf | number: 2}} {{row.v | number: 2}} {{row.fn}} {{row.wsa}} {{row.s}} {{row.trim}} {{row.sink}}
Openings and appendages:
Table 5.4: Flow field details: Select a model to view in fullscreen mode
6. Benchmarking
To assess the performance of the current design with other similar vessels a series of comparable designs have been selected from DNV's Ship Performance Simulator database. The performance of the alternative designs is scaled to feature the same displacement as the current design and thus allows a direct comparison. Delivered power (PD) is used as measure. The following plot(s) show the required power for the current design and the selected designs in an anonoymized form. More details on the benchmarking procedure is given in section 8: Ship Performance Simulator - Methods and Procedures.

Figure 6.1: Benchmarking of simulation results with comparable vessels

{{chart.ReportTitle}}


. Conclusion / Recommendation
. Appendix
.1 List of symbols
Abbreviation Description Unit
AE/A0 Expanded blade area ratio -
BOA Width overall m
BWL Max. breadth of water line m
CB Block coefficient at actual draft related to LOS, BOA -
CP Prismatic coefficient at actual draft related to LOS -
CPP Controllable pitch propeller -
D Propeller diameter m
DISPL Displacement of bare hull without shell and appendages t
ETAD Propulsive efficiency -
ETAH Hull efficiency -
ETAO Open water efficiency of the propeller -
ETAR Relative rotative efficiency -
Fn Froude number -
FPP Fixed pitch propeller -
J Advance coefficient -
KMT Transverse metacentric height above base line m
KQ Torque coefficient -
KT Thrust coefficient -
LCB Longitudinal center of buoyancy from aft perpendicular m
LOA Length overall m
LOS Length of submerged hull (transom to bulb tip) m
LPP Length between perpendiculars m
P/D Pitch ratio of propeller blades -
DP Delivered power kW
PE* Effective power obtained from self-propulsion analysis with load variation kW
RT* Total resistance obtained from self-propulsion analysis with load variation kN
S Wetted surface (dynamic)
T Draft m
T Draft m
t Thrust deduction fraction -
T_des Moulded draft at design condition (level trim) m
T_scantling Moulded draft at scantling (level trim) m
TA Draft at aft perpendicular m
TF Draft at forward perpendicular m
TH Thrust force kN
TM Mean draft ((TA+TF)/2) m
V Ship speed kN
W Wake fraction number -
WSA Wetted surface area (static)
Z Number of propeller blades -
.2 Conventions
.2.1 Coordinate systems
If not otherwise specified, the base coordinate system is right handed. Its origin is in the midship plane on the base line and at the aft perpendicular (AP). The positive X-Axis is pointing forward (to the bow) and the positive Z-Axis is pointing up. Thus, the positive Y-Axis is pointing to port side.
.2.2 Draft, heave and sinkage
Initial static drafts are specified positive, even though the ship is moved in negative z-direction from the base to the computational coordinate system. Dynamic heave motions however are given with respect to the computational coordinate system, i.e. a negative heave means a sinkage of the ship.
.2.3 Trim and trim angle
A trim in [m] is defined positive for a bow up trim and negative for a bow down trim. This is independent of the coordinate system and derived by:
TRIM = TA - TF
A trim angle is defined w.r.t. the coordinate system. I.e. in the standard base coordinate system a positive trim angle denotes a bow down trim.
.2.4 Hydrostatic and hydrodynamic reference length
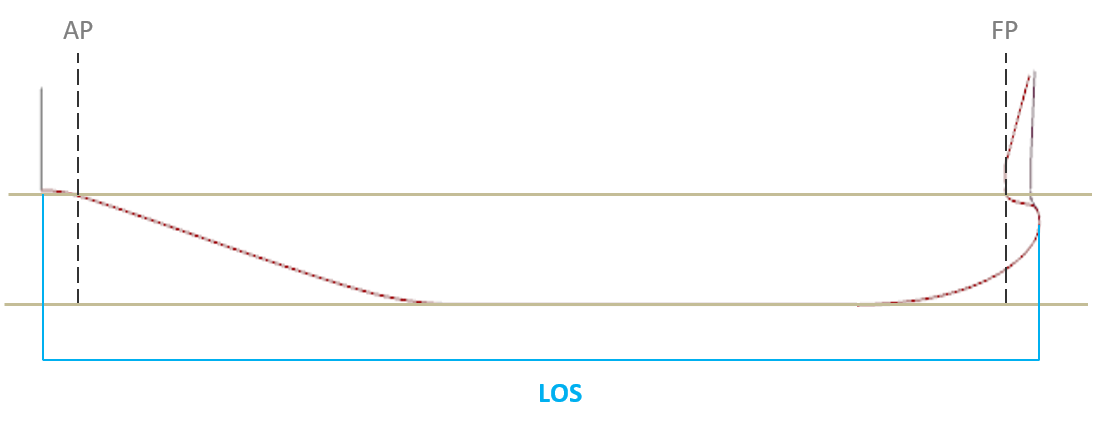
With modern slender and (near) vertical stem designs, gently inclined buttock lines near the transom and a freely selectable aft perpendicular (AP), neither LPP nor LWL provide an unambiguous hydrodynamic and hydrostatic reference length. To ensure a consistent and unambiguous comparison of different hull forms the length of submerged hull (LOS) will be used here for the definition of:
CB, LCB (%LOS from LOS/2), L/DISPVOL³, Re, etc
LOS is defined as the distance from the most forward submerged point of the hull to the transom:
. Report revision history
Date Revision Prepared by Approved by Remarks
{{item.date | date}} {{"v" + ($index + 1)}} {{item.preparedBy}} {{item.approvedBy}} {{item.remarks}}